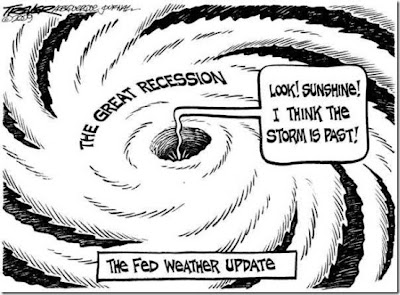
Bearing that in mind, take a look at these hideous graphs (click to enlarge), from a long report titled Economic and Financial System Train Wreck Dead Ahead:

It's not that stock prices have gone up astronomically. The Dow and S&P (which are aggregate price measures) are still far below the highs they reached in 2007. What's happened, of course, is that earnings have plunged precipitously:

Check out the x-axis. This chart goes back 75 years. Nothing even remotely like this has happened since the Great Depression.
So why have stocks kept up these price levels? If earnings are down 98% since the 2007 highs, why are stocks down only around a third? Is this why Congressman Grayson asked the Fed whether they manipulate stock markets?
Stocks have not been rallying because there is any sort of recovery underway. Numbers may tack up or down a little bit, they may vary from one month to the next, they may appear to improve temporarily because of bailouts or foreclosure moratoriums or Cash for Clunkers. But there is no recovery. Eventually stocks will have to "correct" to reflect reality.

No comments:
Post a Comment